
How-to
Using the Enphase app: a homeowner’s guide
Enphase puts a microinverter on every panel — so its app can show production panel by panel. Here’s how to read it and get the most from it.
What the Enphase app shows you
If your solar system runs on Enphase, the Enphase app — you may have known it as Enlighten — is your window into it. Because Enphase uses a small microinverter on each panel instead of one central inverter, the app can show production panel by panel, and it gives you a clear read on how much you’re producing, using, storing, and exchanging with the grid.
The first time in, you either create an Enphase account or your installer links your system to you. Once you’re connected, four tabs run along the bottom — Status, Energy, Array, and Menu — and that’s the whole app.
Your status screen at a glance
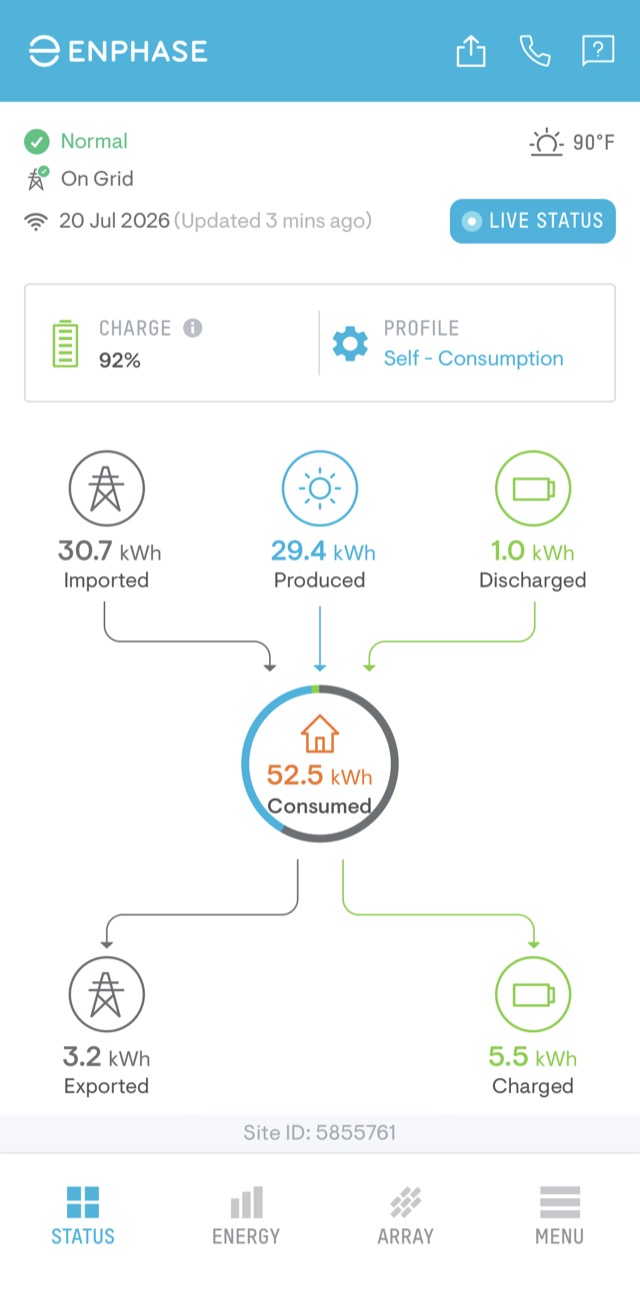
The Status tab is home base. At the top it tells you whether your system is running normally and whether you’re on the grid; below that, it sums up your day — how much you produced, how much your home consumed, what you imported from and exported to the grid, and, if you have a battery, how much it charged and discharged. Your battery’s charge level shows here too.
The single most useful thing on this screen is the word at the top: a green “Normal” means the system is healthy and reporting. Anything else is worth a closer look.
Watching it live
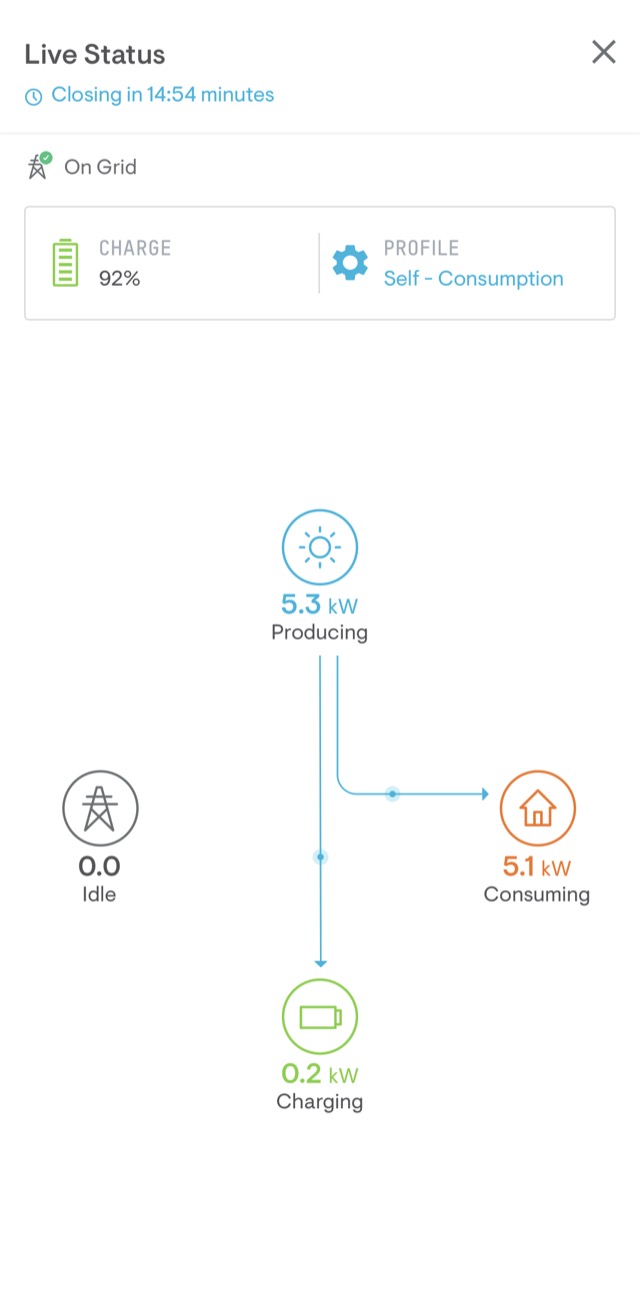
Tap Live Status and the app shows your system in real time — how many kilowatts your panels are producing this moment, how much your home is drawing, and whether you’re pulling from or sending to the grid (and charging a battery). It’s the clearest way to watch a cloud pass over your roof or see a big appliance kick on.
Live status runs for a limited window — it closes itself after about 15 minutes to save resources — so if it stops updating, just reopen it for another live look.
Panel by panel: the microinverter advantage
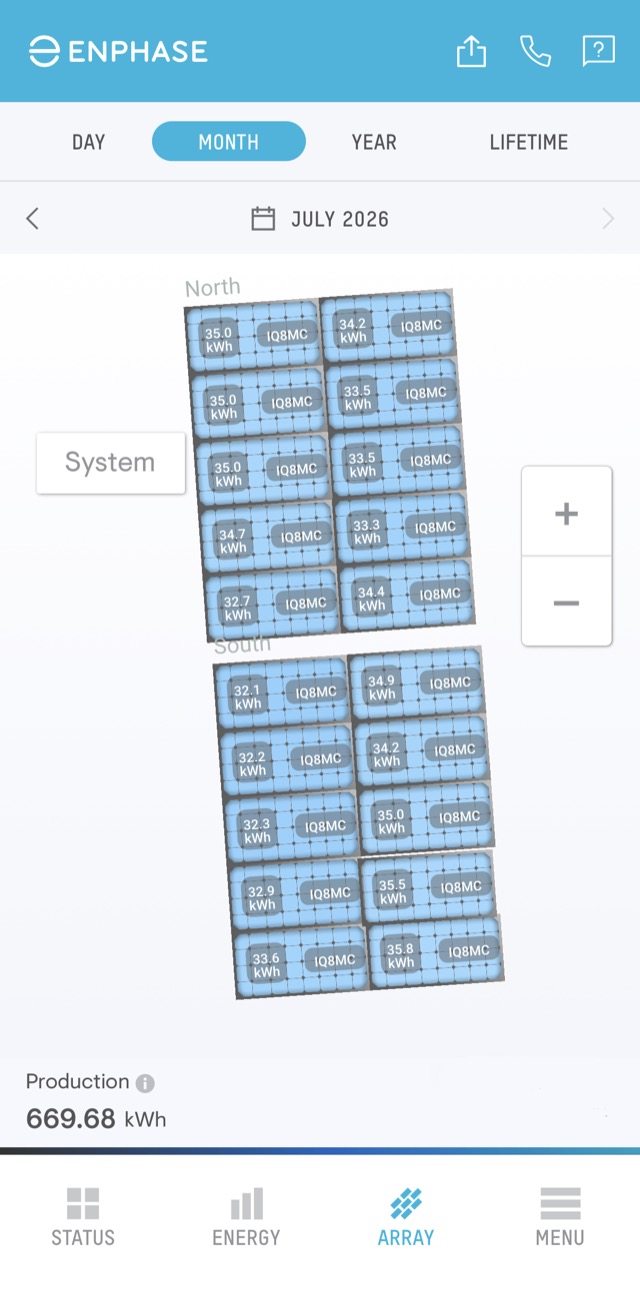
Because every panel has its own microinverter, the Array tab shows a layout of your system with each panel’s production. That’s a real advantage: if one panel is shaded, soiled, or underperforming, you can often see exactly which one instead of guessing about the whole system.
On a clear day, healthy panels produce at similar levels. One panel consistently lower than its neighbors is the one worth asking about.
Energy over time
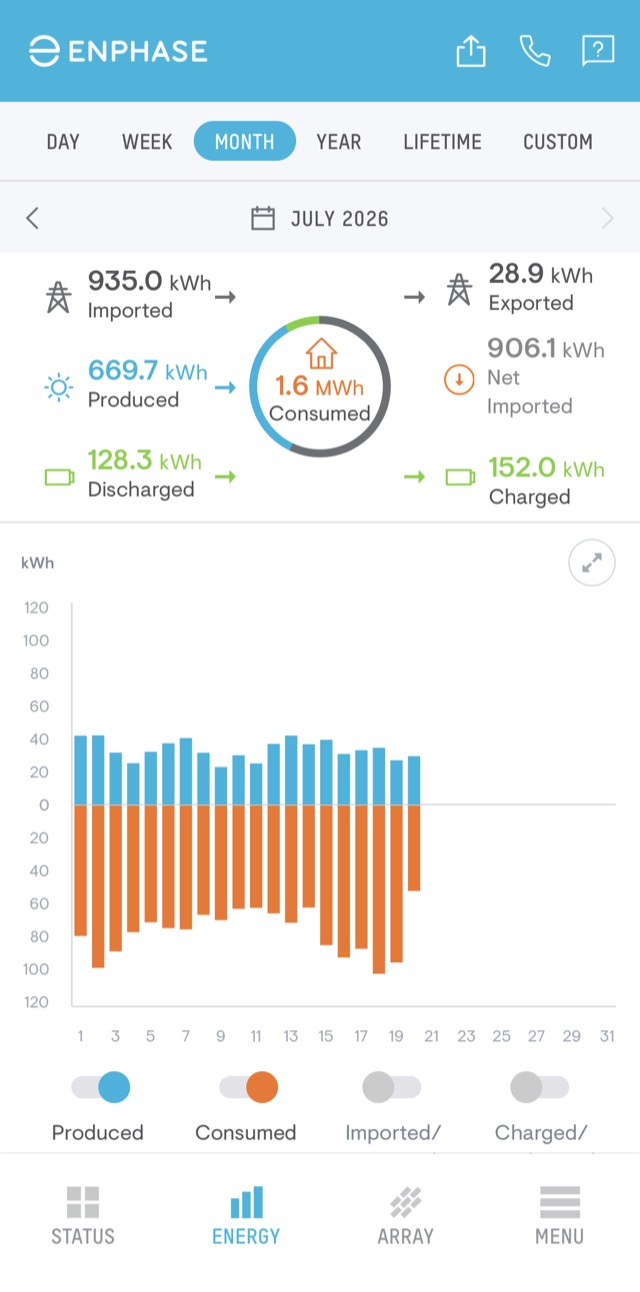
The Energy tab charts your production against your consumption over the day, week, month, year, or lifetime. The bars make your patterns easy to read — strong summer months, cloudy stretches, or a jump in usage after you add a big load like an EV charger or heat pump.
Your performance and impact
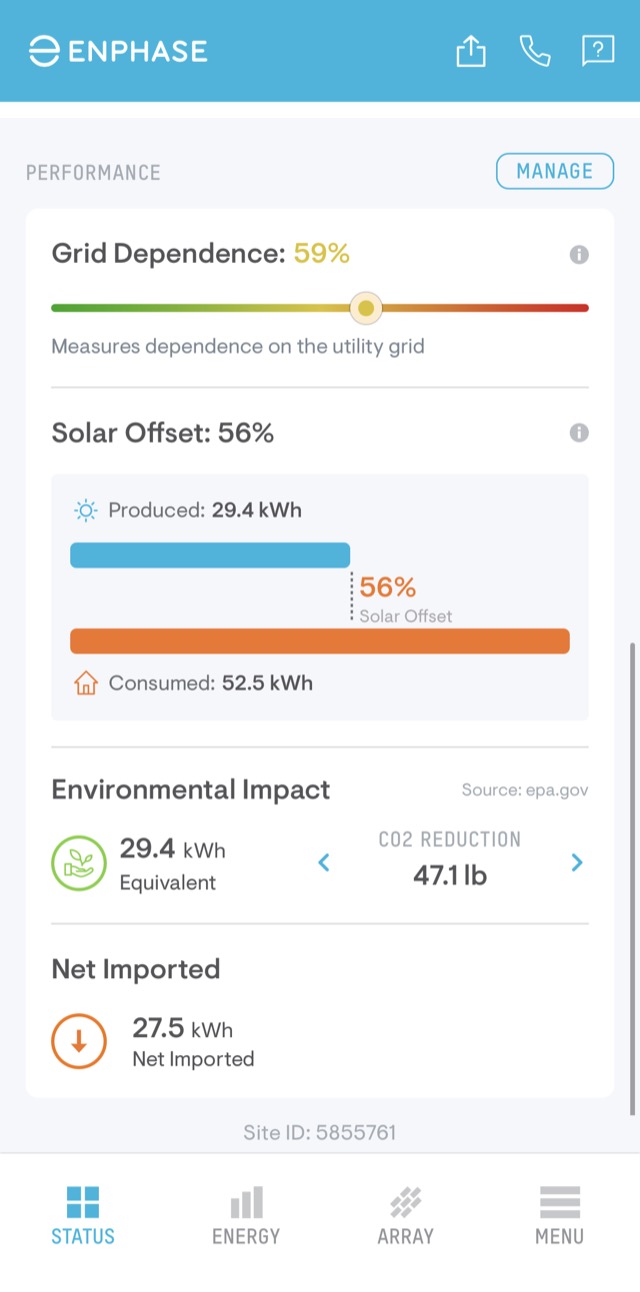
Enphase also rolls up the bigger picture: your solar offset (how much of your usage your panels covered), how dependent you still are on the grid, and the environmental impact — CO₂ avoided, translated into everyday terms. It’s a satisfying gut-check that your system is doing its job.
Battery and backup
If your system includes an Enphase battery (an IQ Battery), the app manages it too. Your battery profile — Self-Consumption, Savings, or Full Backup — sets how it behaves: using your stored solar to cut your bill, optimizing around your utility’s rates, or holding a reserve so you’re covered in an outage. You’ll see the battery’s charge on the Status screen and can watch it charge from solar during the day and carry your home in the evening.
If something looks off
If the app shows no production in good weather, stale data, or a status that isn’t “Normal,” note what you’re seeing and reach out. ETW Energy services and repairs Enphase systems — and solar from any installer — regardless of who put it in. With your app open, we can read your system’s status and history and pinpoint the issue, often before a visit.
Frequently asked questions
What is the Enphase app?
It’s the homeowner-facing app (formerly Enlighten) for solar systems built on Enphase microinverters. It shows system status, a live power-flow view, panel-by-panel production, energy over time, performance, and your battery if you have one.
Can I see how much each solar panel is producing?
Yes. Because Enphase puts a microinverter on every panel, the Array tab shows each panel’s output on a layout of your roof — which makes it easy to spot a shaded, soiled, or failing panel.
What is Live Status in the Enphase app?
It’s a real-time view of your production, consumption, grid, and battery. It runs for a limited window — about 15 minutes — then closes to save resources, and you can reopen it any time for another live look.
The Enphase app shows no production — what should I do?
First check whether it’s a reporting or internet issue versus a real production problem, and note whether the status still reads “Normal.” If production is genuinely zero in good weather, contact a solar service company — ETW services Enphase systems regardless of who installed them.
Need a hand with your system?
Questions about your app, your production, or something that just doesn’t look right — we service systems we didn’t install.
Get service