
How-to
Using the mySolarEdge app: a homeowner’s guide
If your system runs on SolarEdge, mySolarEdge is how you keep an eye on it — including a per-panel view most solar apps can’t offer. Here’s how to read it.
What the mySolarEdge app shows you
If your solar system runs on a SolarEdge inverter, the app to know is mySolarEdge. It’s the homeowner-facing app — separate from the installer’s monitoring portal — and it shows how much your system is producing, how that energy is being used, and whether everything is running as it should.
The first time you use it, you either create a mySolarEdge account or your installer links your system to you; once it’s connected, the app pulls your system’s live data. And because most SolarEdge systems put a small power optimizer on each panel, mySolarEdge can show production panel by panel — something most solar apps simply can’t do.
Reading your dashboard
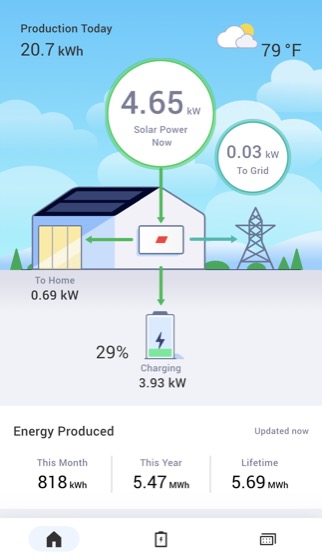
The home screen is your system at a glance: how much power you’re producing right now, and your energy totals for the day, month, and year. If your system includes consumption monitoring or a battery, you’ll also see a power-flow view showing which way energy is moving between your solar, your home, the grid, and any battery.
A few numbers worth knowing:
- Current power (kW): what your panels are making this instant — it rises and falls with the sun.
- Energy today (kWh): total production so far today; compare it to similar days to spot anything unusual.
- Self-consumption / green power: how much of your own solar you’re using rather than buying from the grid.
Panel by panel: the SolarEdge advantage
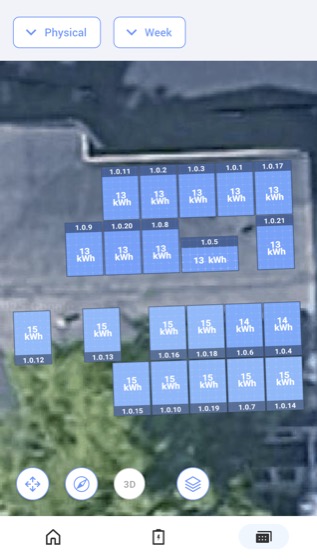
Here’s where SolarEdge stands out. Because there’s an optimizer on each panel, mySolarEdge can show a layout of your roof with each panel’s output. If one panel is shaded, dirty, or starting to fail, you can often see exactly which one — instead of guessing about the whole system.
On a clear day, healthy panels produce at similar levels. One panel consistently lower than its neighbors is worth a closer look. (The panel-level layout needs your installer to have mapped your panel positions; if you don’t see it, that mapping may not have been set up.)
What you produce vs. what you use
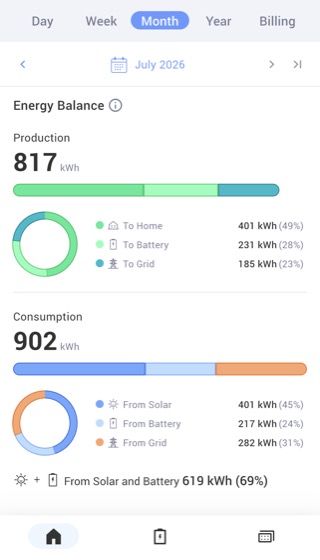
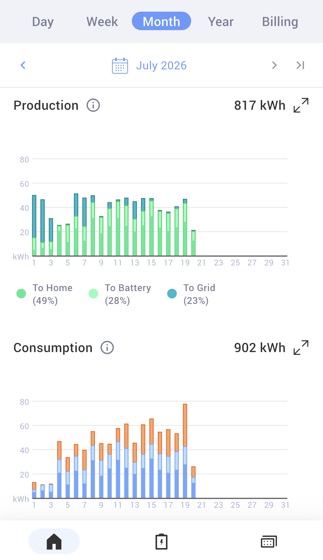
If a consumption meter was installed with your system, mySolarEdge shows not just what you produce but what your home actually uses — and how much of your solar you’re consuming yourself versus exporting to the grid. That’s the clearest picture of how your system is offsetting your bill.
If you don’t see home-usage data, your system is likely on production-only monitoring. That’s common and perfectly fine — you’ll still see everything your panels are making.
System status and alerts
The app shows your system’s overall status. A healthy system reports normally with no alerts. If something needs attention, mySolarEdge flags it — and the most common thing you’ll run into isn’t a solar fault at all, but a reporting gap: the system is producing fine but has lost its internet connection at the inverter, so the app shows stale or missing data.
If you ever see an alert or an error, note what it says. That’s exactly what a service technician will ask about, and it often points straight to the cause.
Battery and backup
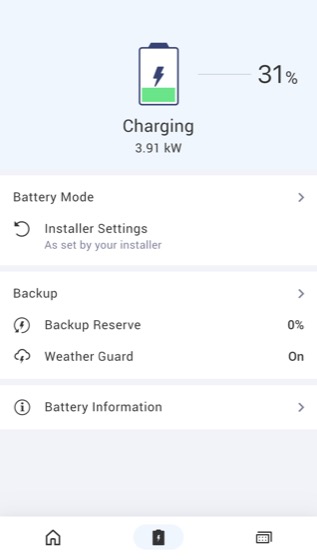
If your system includes a SolarEdge Home Battery, the app shows its charge level and, on backup-capable systems, whether it’s ready to carry your home through an outage. Just like the rest of the dashboard, you can watch it charge from your solar during the day and power your home in the evening — shifting your own clean energy to when you need it most.
SolarEdge’s version of storm protection is called Weather Guard: when severe weather is forecast, it can top your battery off so you have backup ready when you might need it.
Seeing your solar’s impact
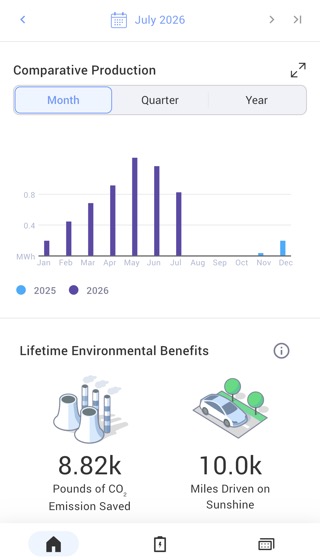
Beyond the day to day, mySolarEdge adds up the big picture: how this year’s production compares to last, and the lifetime environmental benefit of your system — pounds of CO₂ avoided, translated into everyday terms. It’s a nice reminder of what your roof has been quietly doing.
If something looks off
If the app shows no production in good weather, stale data, or an alert you don’t understand, note what you’re seeing and reach out. ETW Energy services and repairs SolarEdge systems — and solar from any installer — regardless of who put it in. Having the app open when you call lets us read your system’s status and history and diagnose quickly, often before a visit.
Frequently asked questions
What is the mySolarEdge app?
mySolarEdge is the homeowner-facing app for solar systems built on a SolarEdge inverter. It shows your production, how your energy is used, panel-by-panel output, system status, and battery charge if you have one.
Can I see how much each solar panel is producing?
Usually, yes. Because SolarEdge uses a power optimizer on each panel, mySolarEdge can show a roof layout with each panel’s output — which makes it easy to spot a shaded, dirty, or failing panel. It requires your installer to have mapped your panel positions.
Why doesn’t the app show my home’s energy use?
Seeing home usage requires a consumption meter to have been installed. If you only see production, your system is on production-only monitoring, which is common and works fine — you just won’t see consumption or self-use figures.
The mySolarEdge app shows no production — what should I do?
First check whether it’s a reporting or internet issue versus a real production problem, and note any alert the app shows. If production is genuinely zero in good weather, contact a solar service company — ETW services SolarEdge systems regardless of who installed them.
Need a hand with your system?
Questions about your app, your production, or something that just doesn’t look right — we service systems we didn’t install.
Get service